I convene the year 2 module `Force and function at the Nanoscale`. In this course we consider how the interplay between thermal energy and nanoscopic forces explain many interesting everyday phenomena around us. Where does surface tension come from? What is happening when you scramble an egg? How is it that a ladybird or gecko can walk upside down across a perfectly smooth ceiling? The module applies many ideas present in thermal and statistical physics, showing how they apply and provides a good groundwork for more advanced topics in later years such as Soft Matter and Biological Physics.
Liquid crystal displays are widely used in modern display technology; first appearing in digital watches and calculators, they are now used in everything from mobile phones to TV screens. LCDs are the leading devices in display technology, with a global market of approximately $100 bn.
This outreach activity explores the optical properties of a liquid crystal and their response to an electric field.
X-ray diffraction
Much of our understanding of the atomic structure of crystals is due to X-ray diffraction. This technique was first used in 1912 by Paul Ewald and Max von Laue, and has since contributed to several major breakthroughs, such as determining the structure of DNA. this
practical explores the physics of x-ray diffraction.
Force chains
Have you ever wondered, whilst playing a board game why the sand grains in an hourglass fall at a constant rate? Intuitively we'd expect the higher the grains the faster the sand would run, as for a liquid. This, and other peculiar phenomena, can be explained by force chains.
Liquid Crystal Displays
Liquid crystal displays are widely used in modern display technology; first appearing in digital watches and calculators, they are now used in everything from mobile phones to TV screens. LCDs are the leading devices in display technology, with a global market of approximately $100 bn.
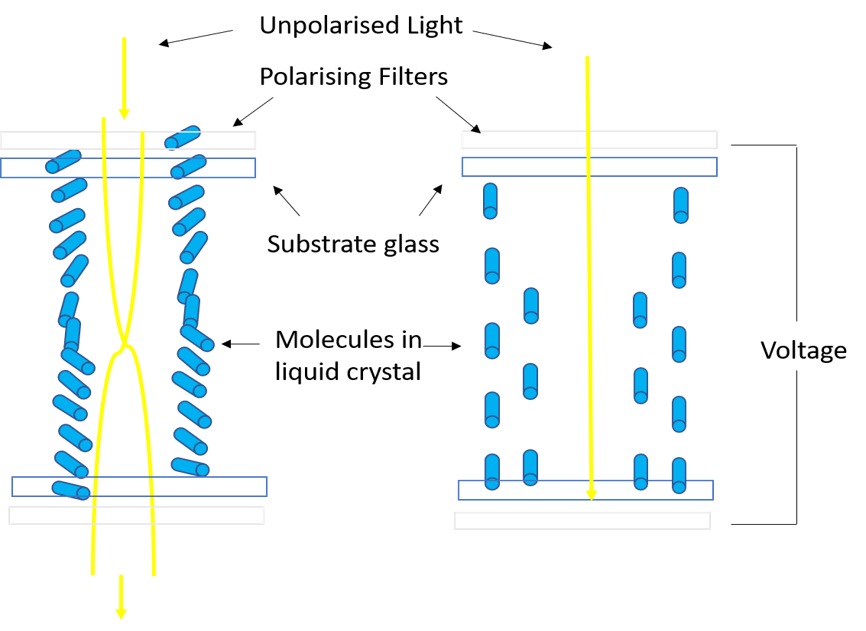
This outreach activity explores the optical properties of a liquid crystal and their response to an electric field. It demonstrates how these can be combined to create a matrix of pixels, and thus form images. In this study we look more closely at how these displays work. A liquid crystal display consists of two polarisers with a liquid crystal between them. Polarisers only allow light with polarisation of a certain orientation to pass through. If two polarisers are rotated to be at 90o to one another, no light can pass through. Placing liquid crystals in between these polarisers, however, results in light travelling through. Why?
Liquid crystals have a special property that makes it favourable for the molecules to self-assemble into a helical shape. As polarised light is incident on each molecule, the light wave is rotated. This means light can pass through the two polarisers. This can be demonstrated using a tube of sucrose solution placed between two polarisers. Sucrose rotates the polarisation of light in a similar way to the molecules in a liquid crystal. As an additional polariser is rotated, different colours of light are blocked.
Figure 1: As the polariser is rotated different colours of light are blocked, creating this spiralling rainbow effect.
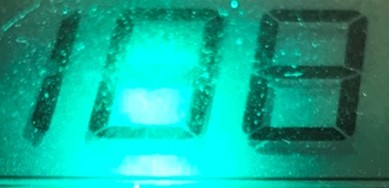
The helical ordering in a liquid crystal can be disturbed by application of a voltage. This causes the molecules to rotate, as shown in Figure 2. In this configuration the polarised light is not rotated. It is therefore blocked by the upper polariser. Switching this voltage on and off effectively changes the transmitted light of a single LCD pixel from dark to light.
Figure 2: An image of the alignment of molecules in a liquid crystal. Molecules are aligned in the helical structure when no voltage passes, and light passes through the polariser (left). Molecules are aligned with the electric field when voltage passes, and light does not pass through the polariser (right).
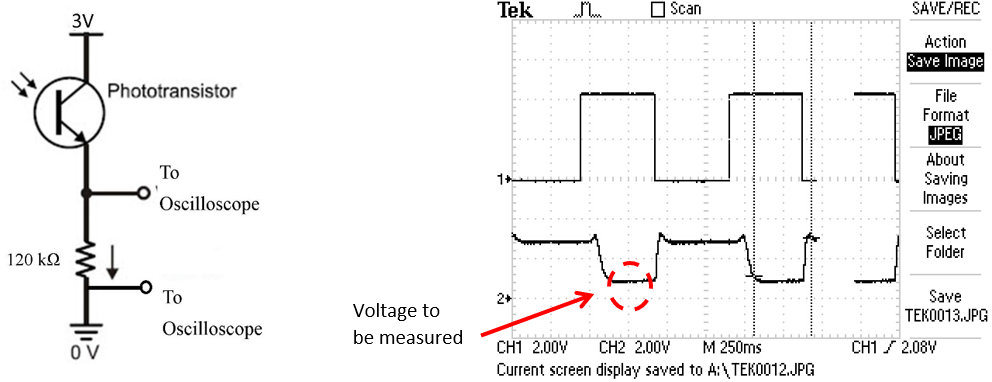
We can carry out a simple lab experiment in order to observe the motion of liquid crystals in a display. To detect the transmitted light we use an electrical circuit, consisting of a phototransistor connected in series with a resistor. Measuring the voltage across the resistor gives us a measure of the amount of light passing through the LCD.
A signal generator applies an alternating voltage to the LCD. This switches the LCD from its favourable helical state (voltage off), to its aligned state (voltage on). We can then observe the changes in transmitted light. Figure 3b shows the voltage (top trace) and the measured intensity (bottom trace) measured using an oscilloscope.
Typically, a liquid crystal display is formed from two transparent plates, with electrodes patterned on each surface. The pattern of observed pixels depends on the pattern of these electrodes.
Gradually decreasing the maximum voltage on the signal generator, we can measure the corresponding transmitted light voltage, from the bottom trace on the oscilloscope. Plotting a graph using these two measurements allows us to find the minimum voltage required to change the state of a pixel on the LCD.
Using the trigger function on the oscilloscope we can also estimate how long it takes for the molecule to rearrange or reform the helical structure, shown in Figures 4a and 4b, respectively.
Figure 4: (a) Using the oscilloscope to measure how long it takes the molecules to align with the electric field. (b) Measuring how long it takes the molecules to reform to the helical structure.
In modern day devices, a series of colour filters can be used to separate the primary colours (red, blue and green), from an ordinary white LED, into sections. Applying different voltages to each colour section, allows different colours to be created. Large scale LCDs consist of thousands of pixels; for reference the iPhone 7 has a 1334x750-pixel resolution.
Figure 5: Microscopic picture showing the pixels on a small section of a solid blue mobile phone screen (left) and solid white mobile phone screen (right).
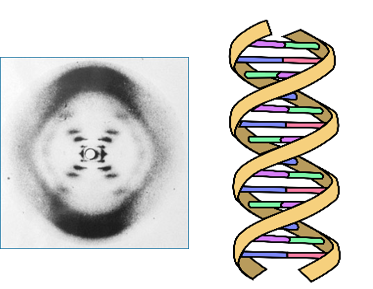
Much of our understanding of the atomic structure of crystals is due to X-ray diffraction. This technique was first used in 1912 by Paul Ewald and Max von Laue, and has since contributed to several major breakthroughs, such as determining the structure of DNA. Famously, a picture of the double helix configuration was taken by Rosalind Franklin in 1952 and, although used to find the precise structure, she was given no credit whilst alive.
Diffraction is a property of waves causing them to spread out after passing through a gap. The amount of diffraction that occurs depends on wavelength and the size of the gap it passes through. Here, we will explore the physics of how X-ray diffraction enables us to determine the structure of a crystal…
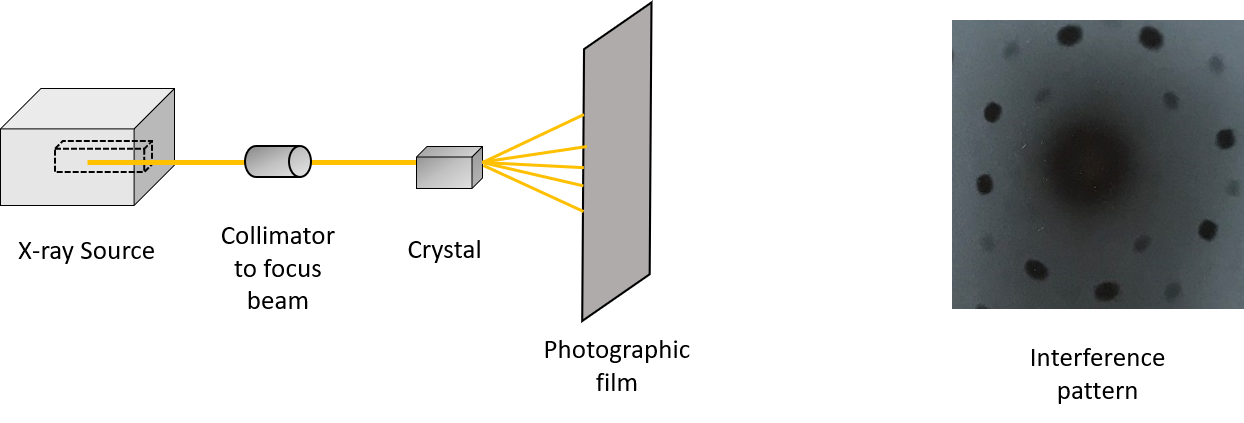
In an x-ray machine, a beam of X-rays passes through a crystal. The beam is diffracted by atoms in the crystal, resulting in an interference pattern on the photographic film, shown in Figure 1. A collimator is used to focus the beam of X-rays on the crystal. But how is this interference pattern related to the structure of the crystal? To explore the physics behind this process we use water waves in a ripple tank.
Figure 1: Schematic of the X-ray machine (left) and the resulting interference pattern created on the photographic film (right).
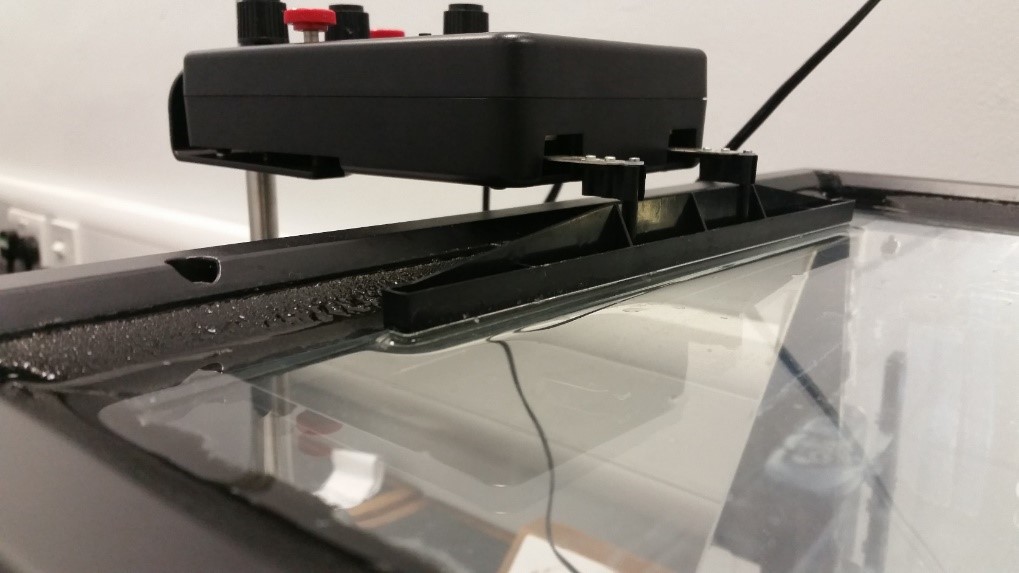
A ripple generator is attached to a plane wave dipper and placed on top of the water in the tank, shown in Figure 2. A strobe light is placed above the tank to illuminate the waves and a gap, of known size, is created by adjusting the sliders. A camera, connected to a computer programme, can be used to observe the wave patterns.
Figure 2: Ripple generator and tank.
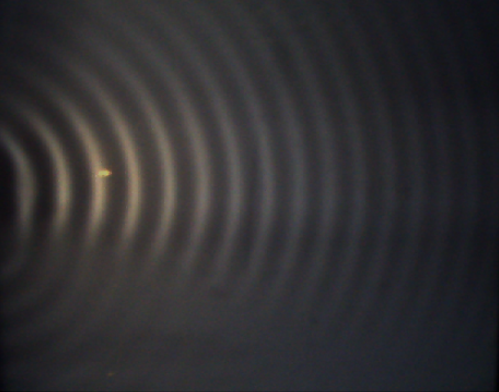
The initially parallel water waves diverge as they pass through the gap, “Diffraction” (see Figure 3). Diffraction is stronger, the closer the wavelength is to the size of the gap. If we use two gaps, the individual diffraction patterns interfere with one another. Depending on the position, the waves from the two slits may combine, “constructive interference”, or cancel one another out, “destructive interference”. Constructive interference appears bright and destructive interference appears dark. If the gaps in the barriers are moved further apart (or closer together) then the locations of constructive interference move closer together (or further apart).
Figure 3: An image showing diffraction in the Ripple tank.
The Ripple tank with 2 gaps produces a result which is similar to the X-ray diffraction experiment. The atoms act like lots of slits, which diffract the X-rays and lead to an interference pattern on the photographic film.
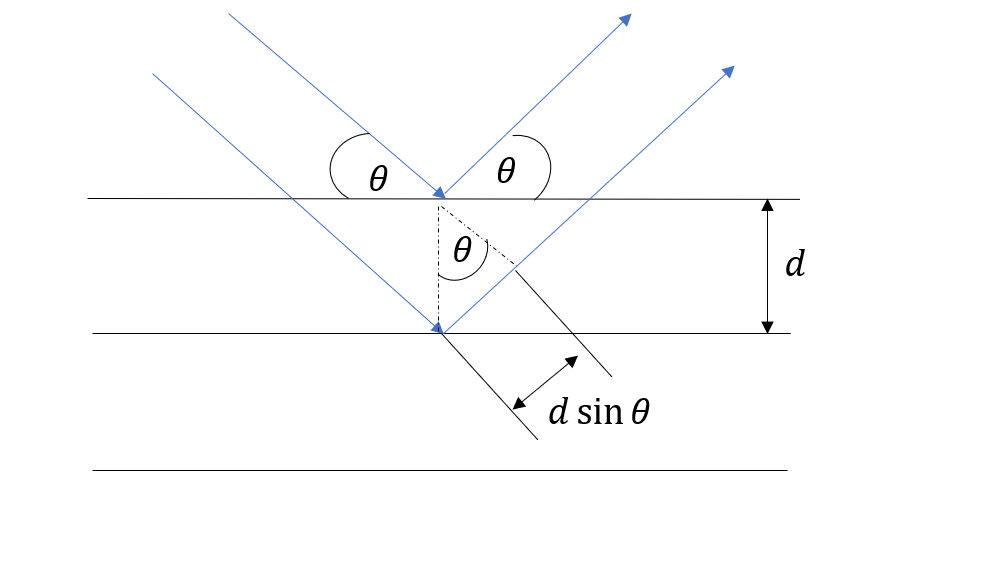
The interference pattern is related to the arrangement of atoms. As the interplanar spacing, d, within a typical crystal is a similar length to the wavelength of X-rays, strong diffraction occurs. The waves are scattered by successive planes, and constructive interference occurs when the path difference, 2d sinθ, is equal to an integral number of wavelengths. This results in a dark spot on an X-ray film. The closer the interplanar spacing, the further apart these spots appear. The complete structure of a crystal, and size of its unit cell, can be resolved by repeating X-ray diffraction at different crystal orientations.
Figure 4: Scattering from successive planes.
X-ray diffraction has contributed greatly to identifying unknown crystal structures, resulting in considerable advances in medicine; among these penicillin and insulin. Furthermore, X-ray diffraction has developed our understanding of non-covalent and metallic bonding, paving the way for other discoveries, such as resonance between chemical bonds. Every structure has a unique interference pattern, meaning X-ray diffraction is useful in determining the percentage purity of a sample.
Force transmission in crystalline materials is widely understood, however disordered materials, such as granular media, have some unexpected properties. Have you ever wondered, amid the anticipation of a board game night, why the sand grains in an hourglass fall at a constant rate? This is not what we would intuitively expect if you compare this with water. This, and other peculiar phenomena, can be explained by force chains…
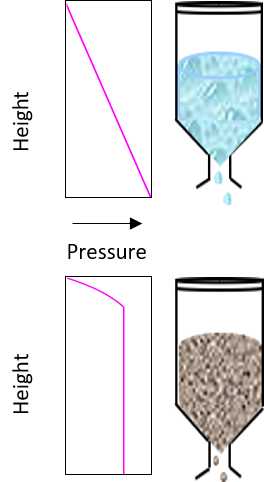
Discharge in an hourglass of water would begin fast, and gradually slow down. This is because the pressure pushing the water through depends on the weight of liquid above it. This also explains why your ears may hurt if you swim to the bottom of a pool. You would expect an analogous result in a pile of sand; however, it turns out the pressure does not increase, regardless of the weight above you. This relationship is shown in Figure 1.
Figure 1: Pressure distribution in water (top) and sand (bottom).
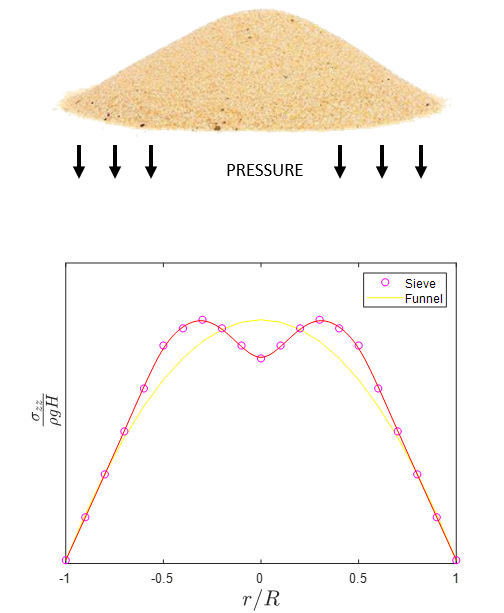
Additionally, the pressure distribution in granular media depends on the method of preparation. You would expect the pressure distribution in two sand piles, with the same shape, to be identical. However, the pressure distribution depends on the way in which the pile is prepared; a conical pile of sand, formed from pouring the sand through a funnel or a sieve results in different distributions. Whilst the former shows the expected result, the latter shows a dip in pressure below the maximum height of the pile, shown in Figure 2.
Figure 2: Radial pressure distribution in two identical sand piles, one formed by a sieve and the other by a funnel.
Both these phenomena can be explained by force chains. When granular matter is subjected to an external load, stress is transmitted heterogeneously through the particles. In fact, a large proportion of the load is carried by a very small number of particles.
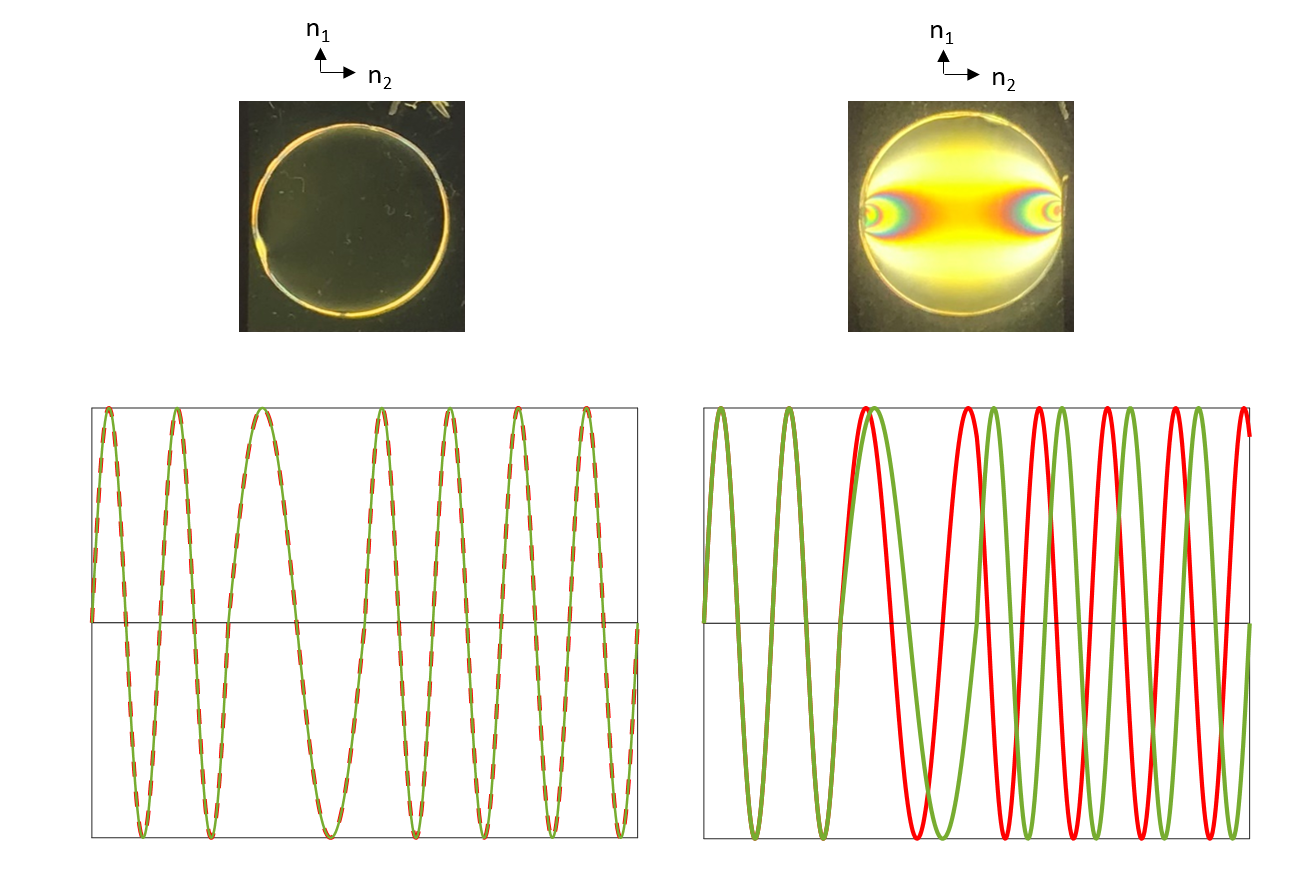
We can carry out an experiment, to observe these force networks, by applying a pressure to a collection of Perspex discs. Perspex becomes birefringent when subjected to a force. Birefringence describes the property of a material which has a refractive index that depends on the polarisation of light. Without a force, the refractive index is isotropic (n1 = n2) so light of different polarisations is retarded by the same amount. However, when subjected to a force, n1 ≠ n2 causing a phase shift between light of different polarisations. The phase shift between different polarisations leads to interference patterns when viewed between polarisers (see Figure 3b), that can be used to estimate the force on a disc.
Figure 3: (a) Light through unstressed birefringent material. The dashed line shows vertically polarised light and the solid line shows horizontally polarised light. (b) Light through stressed birefringent material. The red line shows vertically polarised light and the green line shows horizontally polarised light.
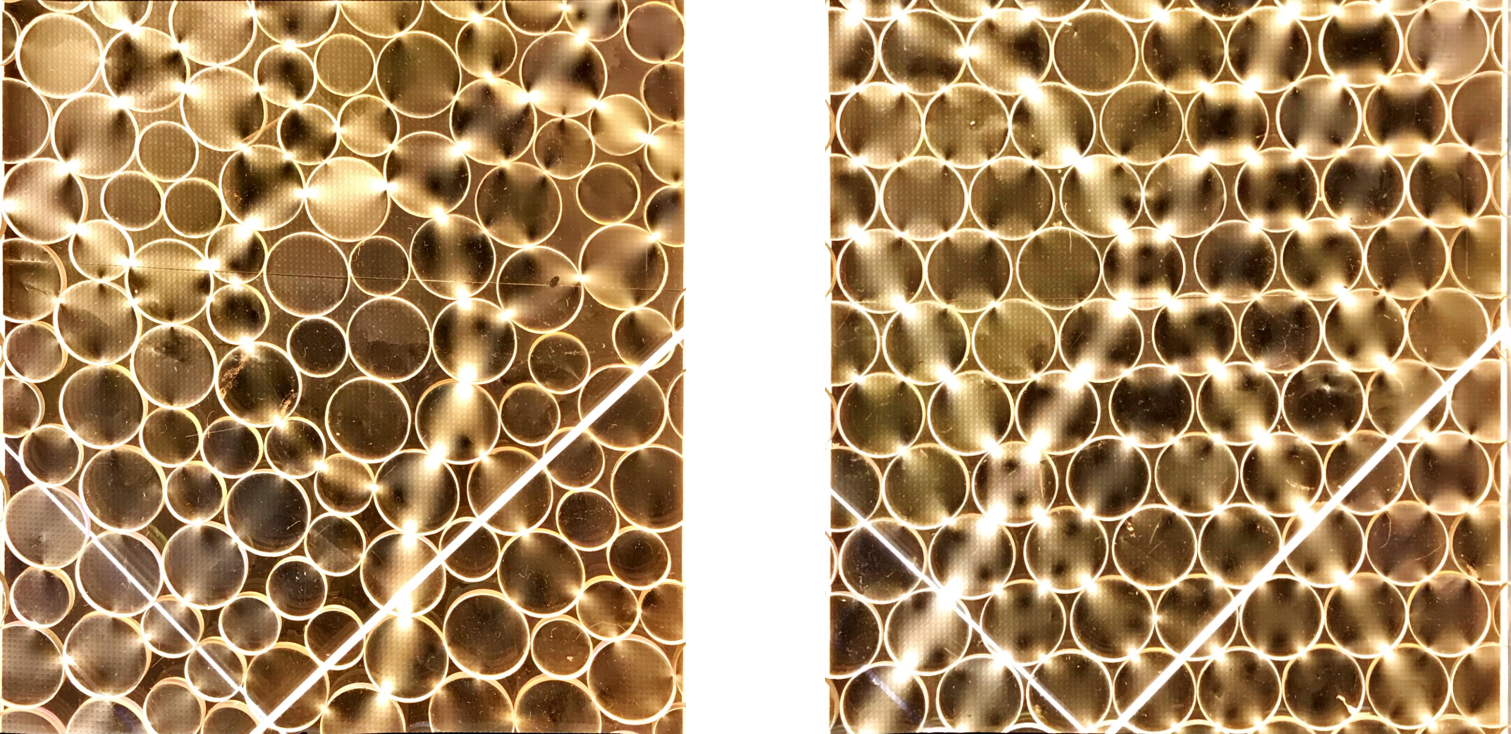
In this practical lots of Perspex discs are placed in a cell and subjected to an external load. Areas where the force is larger than the mean force appear brighter. Comparatively, areas where force is less than the mean force appear darker. However, not all disks contribute to the force transmission. Consequently, we observe chains of bright particles forming, due to the disordered nature of granular media. In crystalline media, force is more evenly distributed.
Figure 4: (a) Discs are arranged in an disordered structure, thus, force chains are formed. (b) Discs are arranged in a crystalline structure, showing an even distribution of force.
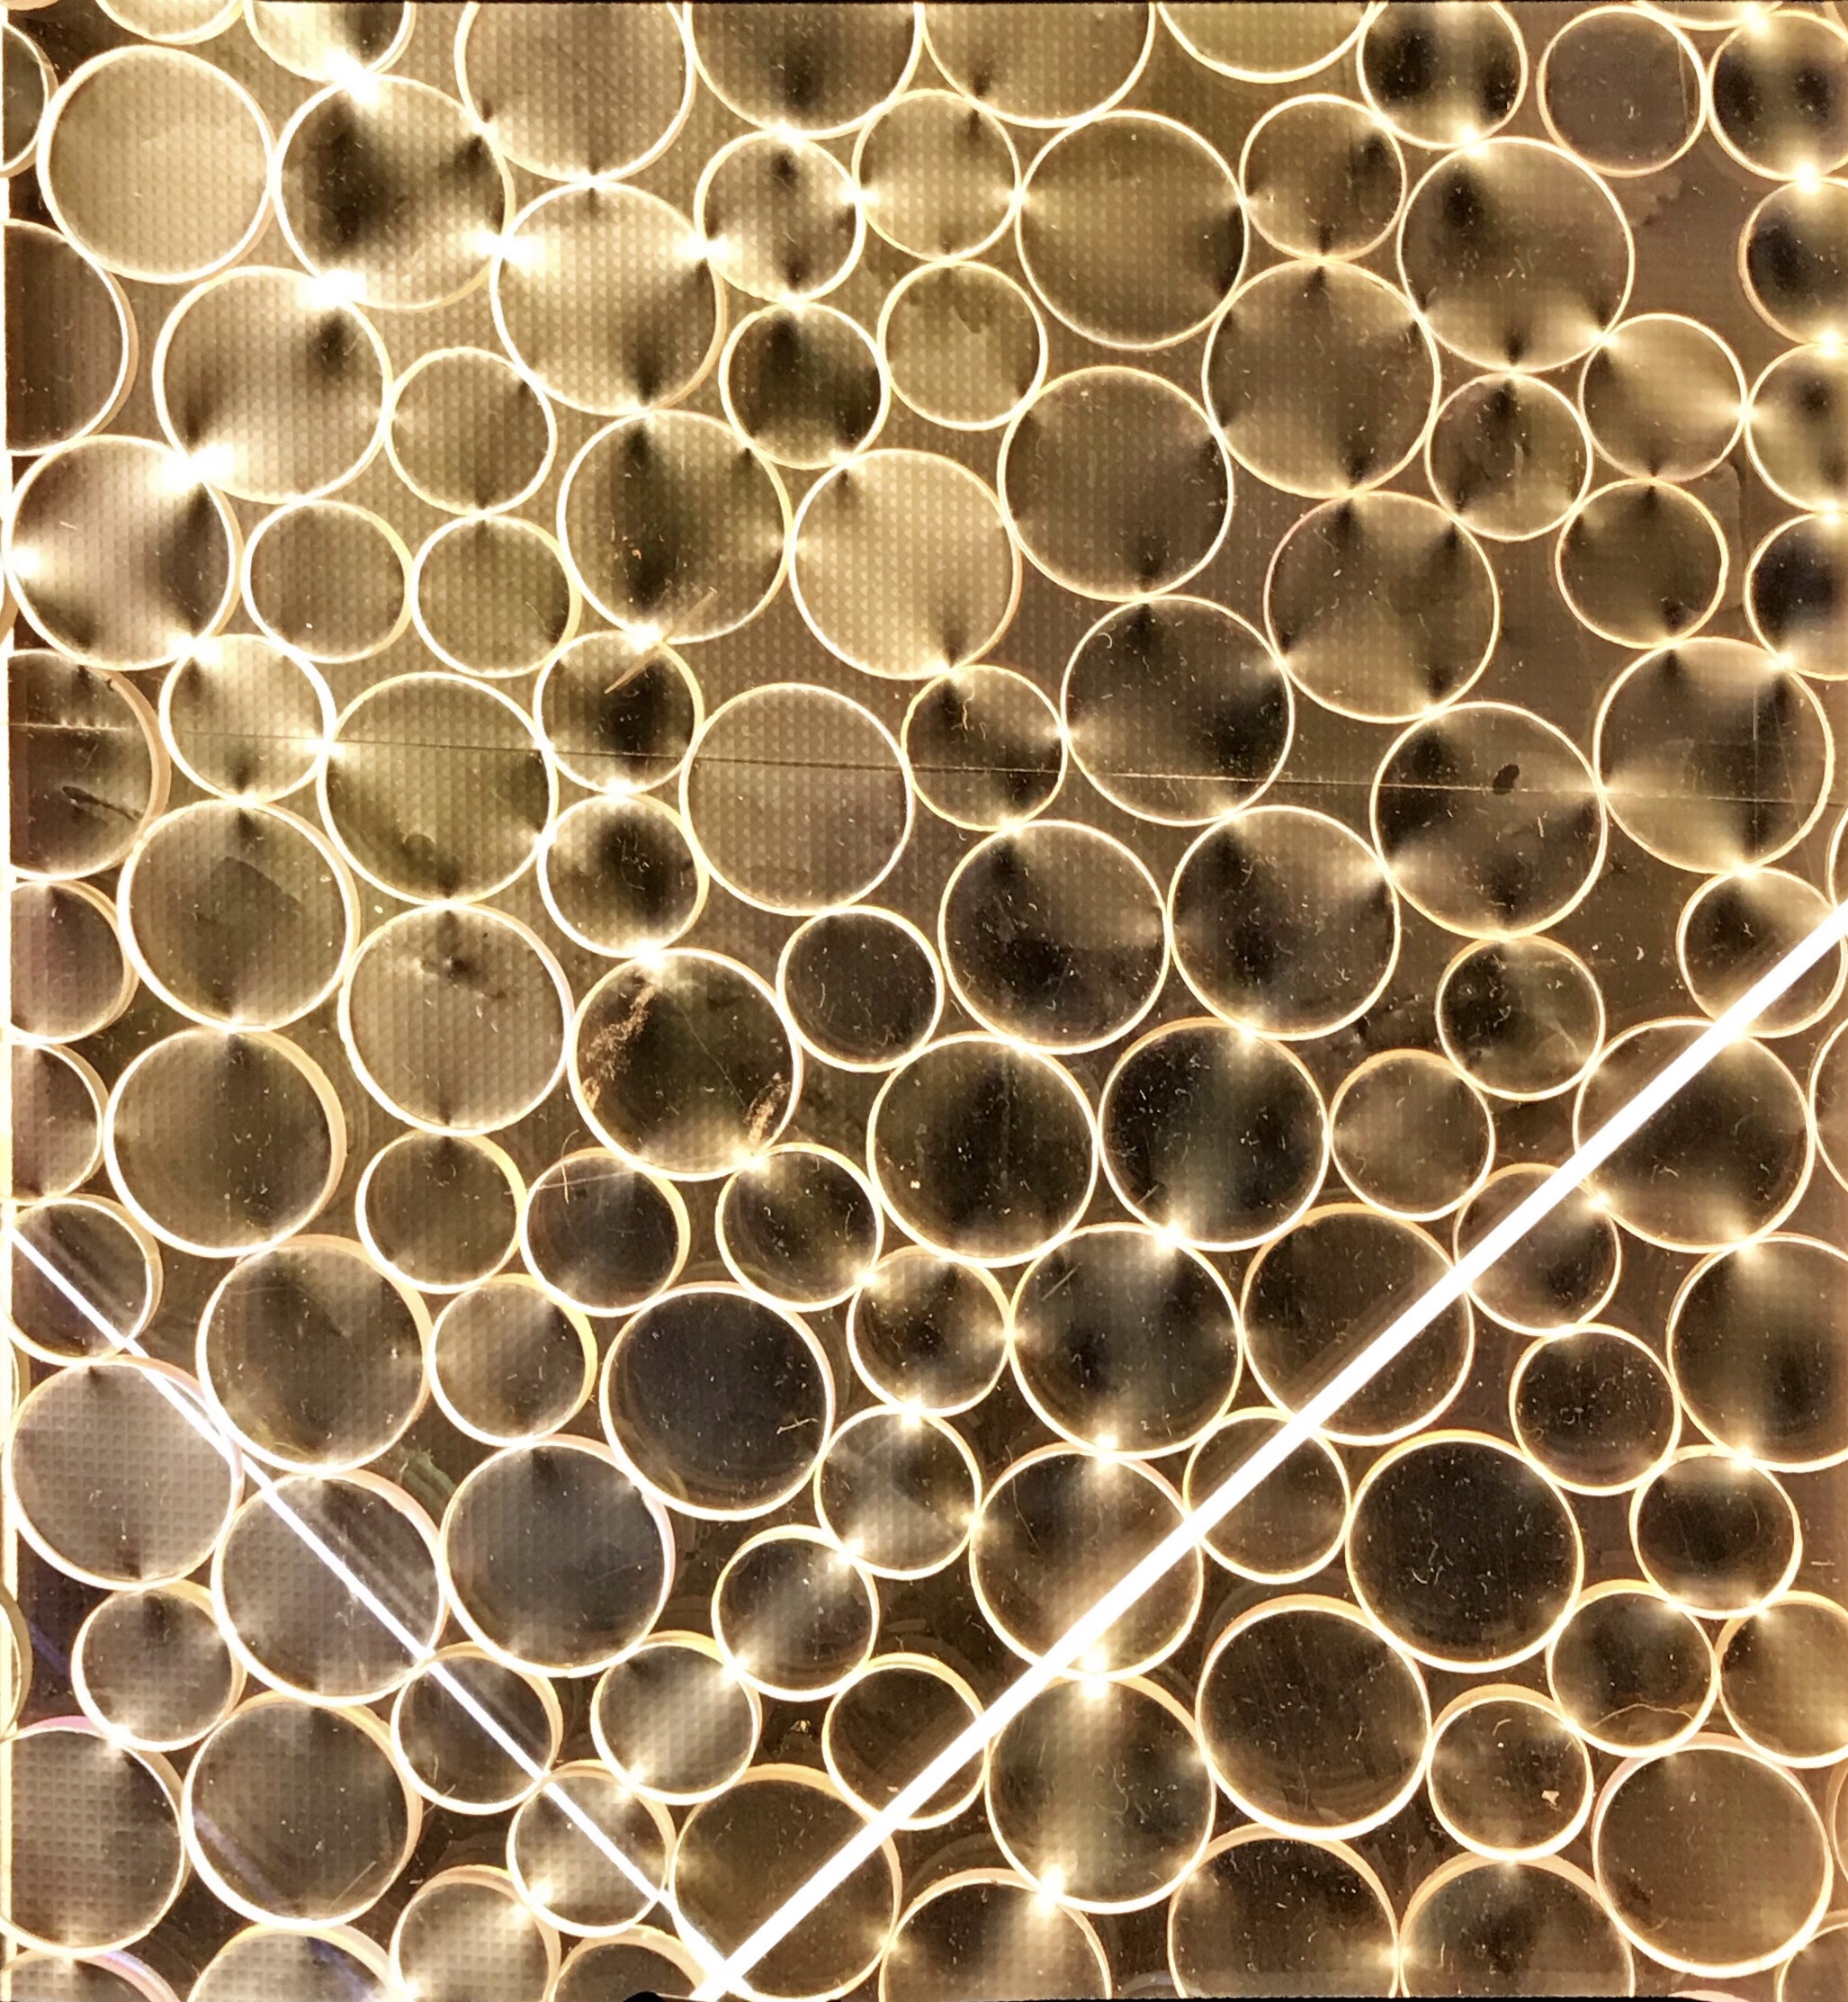
If we make a very small change, by adding one disc to the cell, the disordered nature results in a very different force chain pattern to that shown in Figure 4a.
Figure 5: When we increase the external load contact height, by adding a disc to the cell, a different force chain pattern is observed .
Besides from the visually impressive results created by force chains, there are several, more practical, applications. Granular materials are found widely in the natural world or in civil engineering. Understanding how forces are distributed explains some of the ways in which these materials fail, which are very different from crystalline structures. Additionally, force chain networks can be used to examine the spatial pattern of sound propagation. For further information on this research please see the article
Experimental validation of intricate human physiological systems uses photo-elastic and birefringent materials to assess pressure in dental and medical applications; this could involve the analysis of penetrating impacts on soft tissue, for example. Due to the ethical issues surrounding using human subjects, these materials can act as fairly reliable substitutes for the real systems; many are mechanically comparable to specific tissues. Types of birefringent materials used include polymer resins and gelatine, which model bone and soft tissue, respectively. For further information on this research please see the article
To learn more about force chains please see papers 1 and 2.


 Much of our understanding of the atomic structure of crystals is due to X-ray diffraction. This technique was first used in 1912 by Paul Ewald and Max von Laue, and has since contributed to several major breakthroughs, such as determining the structure of DNA. this practical explores the physics of x-ray diffraction.
 Have you ever wondered, whilst playing a board game why the sand grains in an hourglass fall at a constant rate? Intuitively we'd expect the higher the grains the faster the sand would run, as for a liquid. This, and other peculiar phenomena, can be explained by force chains.